Air Quality and Health in Cities
- Posted By
10Pointer
- Categories
Environment
- Published
24th Aug, 2022
-
-
Context
- Recently, a report was released titled Air Quality and Health in Cities, which analyzed pollution and global health effects for more than 7,000 cities around the world between 2010 and 2019.
-
What is the State of Global Air?
- The State of Global Air (SoGA) is a research and outreach initiative to provide reliable, meaningful information about the air quality around the world.
- The report, Air Quality, and Health in Cities, released by Health Effects Institute’s State of Global Air Initiative, provides a comprehensive and detailed analysis of air pollution and global health impacts for more than 7,000 cities around the world, focusing on two of the most harmful pollutants; fine particulate matter (PM5) and nitrogen dioxide (NO2).
|
Ambient (outdoor) fine particle air pollution (PM2.5):
- It is made up of airborne particles measuring 2.5 µm or less in aerodynamic diameter. Anthropogenic (human) sources of PM2.5 include household burning, energy production, and use, industrial activities, vehicles, and other sources.
- PM2.5 is an atmospheric particulate matter of a diameter of fewer than 2.5 micrometers, which is around 3% the diameter of human hair. It causes respiratory problems and reduces visibility.
- Exposure to PM2.5 can result in cardiovascular (heart), respiratory (lung), and other types of diseases. MORE.
- Nitrogen dioxide (NO2):
- It is a gaseous pollutant and a key marker of traffic-related air pollution. NO2 is particularly abundant in cities and urban areas. NO2 and other nitrogen oxides can also react with other chemicals in the air to form particulate matter and ozone.
- Exposure to NO2 can aggravate asthma symptoms and has been linked to the development of asthma in children and adults.
|
-
Key Findings of the report:
Patterns In Urban PM2.5 Exposure:
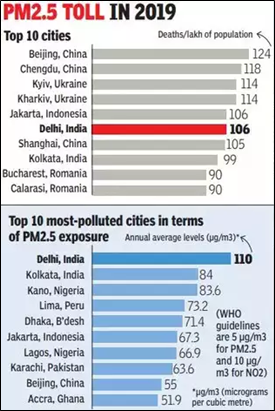
- India and Indonesia have seen the most severe increase in PM5 pollution, whereas China has seen the greatest improvements.
- Delhi and Kolkata are ranked first and second in the list of top 10 most polluted cities when PM 2.5 levels were compared.
- While exposures to PM5 pollution tend to be higher in cities located in low- and middle-income countries, exposure to NO2 is high across cities in high-income as well as low- and middle-income countries.
-
Patterns In Urban NO2 Exposure:
- PM5 pollution tends to be highest in cities in low- and middle-income countries, whereas NO2 levels are high in large cities across countries of all income levels.
- No Indian city appeared in the list of top 10 or even top 20 polluted cities when NO2 levels were compared.
- Average NO2 levels for Delhi, Kolkata, and Mumbai, according to the report, ranged from 20-30 µg/m3.
- NO2 comes mainly from the burning of fuels in older vehicles, power plants, industrial facilities, and residential cooking and heating.
- As city residents tend to live closer to busy roads with dense traffic, they are often exposed to higher NO2 pollution than residents of rural areas.
- Other cities with high NO2 population levels included Moscow, Beijing, Paris, Istanbul, and Seoul.
- A strong link was also found between traffic-related air pollution and lung cancer mortality, asthma onset in children and adults, and acute lower respiratory infections in children.
-
Death Burden:
- Of all cities analyzed, the 20 cities with the highest PM5-linked death rates in 2019, 15 are in China, 3 are in Ukraine, and 2 are in Bulgaria.
- Beijing had the largest disease burden associated with a PM 2.5-related illness, with 124 attributable fatalities per 100,000 persons.
- Delhi came in 6th, with 106 deaths per 100,000, and Kolkata at 8th with 99 deaths.
Area of Concern:
- Ground-based monitoring stations for NO2 are even more scarce than those for PM5, especially in low- and middle-income countries.
- 2022 WHO Air Quality Database reveals that only 117 nations currently have ground-level monitoring systems to track PM 2.5 and PM10, and only 74 nations have ground-based monitoring stations for NO
- In 2019, exposure to pollutants in 86% of the more than 7,000 cities exceeded WHO’s standard, therefore, impacting around 2.6 billion people.
-
Accuracy of Estimates made in the Report:
- Extensive comparisons between these satellite-derived estimates and ground-level measurements demonstrate that they are reasonably accurate. They can be reliable indicators of PM5 and NO2 exposures where ground monitors do not exist or data are not publicly available.
- Since ground measurements are incorporated in the model, estimates are less reliable for regions with fewer or no air monitoring stations (e.g., cities in Africa and Asia).
-
Initiatives by cities to Address Air Pollution:
- London’s Ultra Low Emission Zone initiative delivered a 36% reduction in NO2 in the first six months after its launch in 2019.
- In Nepal, local entrepreneurs teamed up with experts to help build more efficient, less-polluting kilns using zig-zag technology.
- AirQo was launched in 2015 at Makerere University with the goal of addressing the data gap on air quality in Uganda and across Sub-Saharan Africa.
-
Suggestions made in the Report:
Collection and digitization of Health records:
- Access to the consistent and systematic collection of city-level health data is crucial to researchers. This can help researchers conduct more accurate and local analyses that inform communities and policymakers.
- Data on the “burden of air pollution on health” are vital for assessing the effectiveness of interventions, both in terms of public health benefits and economic impact.
-
Leverage the expanding ‘air quality monitoring toolbox’:
- Increasing the density of air monitors, which are important to track key pollutants to improve the accuracy of estimates of Pollutant levels
- In addition to setting up monitors, it is important to invest in resources for calibration and maintenance to ensure the quality of data from these monitors.